Outcome Data for Southampton CS
The release of accurate hospital and individual surgeon outcome data after heart surgery is mandatory in the UK. The data from the National Adult Cardiac Surgery Audit are published on the Society for Cardiothoracic Surgery in the UK and Ireland website (www.scts.org).
The three Southampton CS Surgeons operate at Spire Southampton Hospital and University Hospital Southampton (UHS). The most recent update available, for the period 1st April 2015 to 31st March 2018, shows Spire Southampton Hospital is the only hospital in the UK that has survival outcomes after heart surgery that are statistically ‘better than expected’. The data also shows that UHS is one of the busiest hospitals in the UK, with unusually complex cases and outstanding results for patients after heart surgery. The update also confirms that the three Southampton CS Surgeons are all in the top six, of about 300 cardiac surgeons in the UK, for number of operations performed and all have outstanding, risk-adjusted survival survivals for their patients.
The complex method for reporting and explaining risk-adjusted outcomes, as well as what procedures are included and excluded, is detailed on www.scts.org. The following graphs show more up to date and easy to understand performance and outcome data for the three Southampton CS surgeons for the most recent three-year period, April 2017 to March 2020.
Graph 1 compares the average number of major heart operations performed by the three Southampton CS surgeons for this period with the average number of operations performed by other UK surgeons in the three years from April 2014 to March 2017, the last three year period for which the Society for Cardiothoracic Surgery in the UK and Ireland provided this information. The three Southampton CS surgeons all perform nearly three times more heart operations than the UK average.
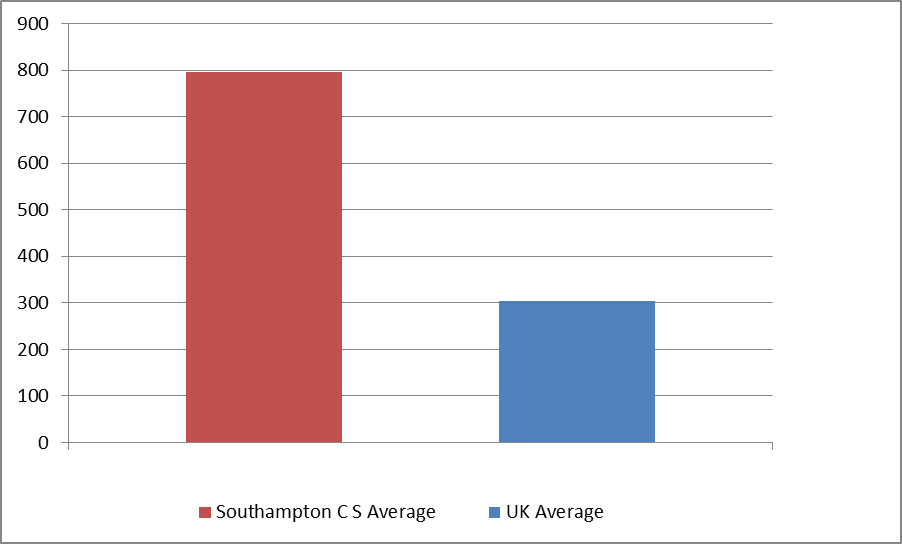
Graph 1 Average number of operations performed per surgeon over 3 years
Graph 2 shows the different types of operations performed by our surgeons or ‘Case Mix’. Abbreviations include ‘Isolated’ when the procedure is carried out on its own, CABG (Coronary Artery Bypass Grafting), AVR (Aortic Valve Replacement), MVR (Mitral Valve Repair/Replacement) and complex ‘Other’ procedures, including double valve procedures, redo-operations and major thoracic aortic work. The average number of each type of operation is calculated using Case Mix data of operations performed by other UK surgeons in the three years from April 2014 to March 2017, the last three year period for which the Society for Cardiothoracic Surgery in the UK and Ireland provided this information. This is compared with the average number of different types of operation for our surgeons from April 2017 to March 2020. The three Southampton CS surgeons all have a considerable experience in the entire range of open heart procedures, including the most complex operations.
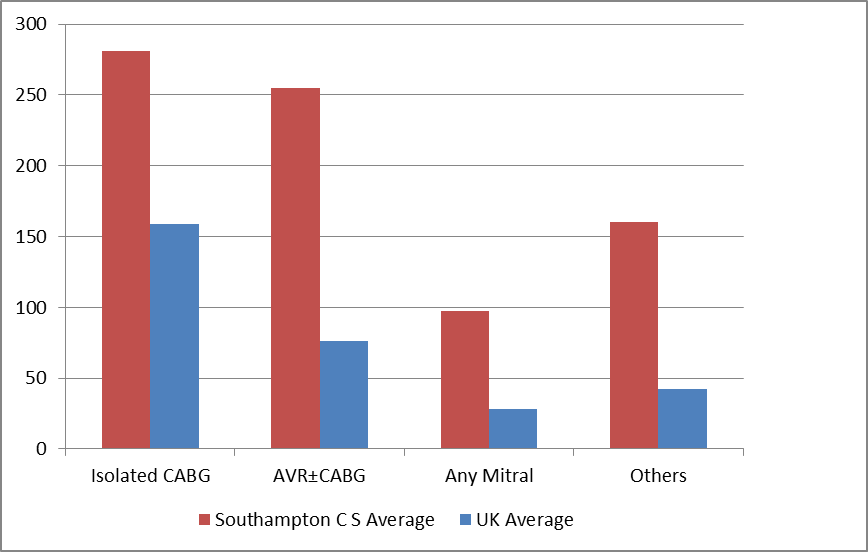
Graph 2 Average number of different types of operation performed over three years by individual surgeons
Different methods are used to demonstrate mortality rates after heart surgery. These may be shown as complicated statistical ‘Funnel’ plots or ‘Forest’ plots as on www.scts.org and may be ‘risk-adjusted’ according to certain patient or operative factors. The latest update on www.scts.org confirms that the three Southampton CS Surgeons all have outstanding, risk-adjusted survival outcomes for their patients and all are considerably better than the UK national average.
Graph 3 shows the performance of our surgeons, in terms of simple mortality rates without risk-adjustment, for all elective and urgent cases and for the two most common heart operations, isolated CABG and isolated AVR. Emergency operations are excluded. These are compared to the latest UK average for April 2015 to March 2018 as shown by the National Adult Cardiac Surgery Audit.
This again confirms outstanding performance by the Southampton CS surgeons.
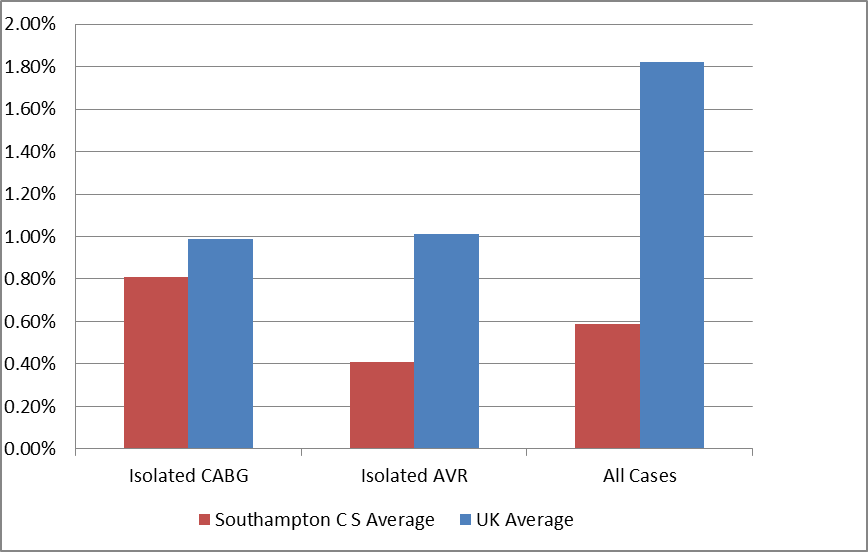
Graph 3 In-hospital mortality rate comparing Southampton CS surgeons with UK average